Real-time dashboards for their major brands, with over 500 daily users.
We are a leading reference in Data Visualization, with a team of over 60 Power BI professionals.
Integration of 30+ cloud data sources to optimize decision-making in the Spanish tourism sector.
We transform your data into valuable insights
Today, companies handle large volumes of data from multiple sources, but many struggle to analyse and interpret that data effectively. This gap limits their ability to make fast, informed decisions. Additionally, the lack of multidisciplinary teams with both technical and storytelling skills makes it difficult to unlock the full value of available information.
At hiberus, our expert Data Insights team transforms complex data into clear, accessible stories. We simplify data storytelling, so organizations can communicate key information effectively, build trust, and support strategic decisions that drive growth.
We unlock the full potential of your data
At hiberus, we understand that gaining insights into your business and its performance is key to moving forward and building strong strategies. That’s why we’ve developed our own methodology to help you truly understand your data.
Data Collection
We gather all relevant data and information from your business.
Data Analysis
We analyze your data to deliver comprehensive data processing solutions.
Data Preparation
We enable segmentation, storage, and management of your essential data.
Data Storytelling
We create a compelling business narrative based on your data.
Data Visualization
We organize and transform your data into charts and reports to make it easy to understand.
What sets us apart
1st prize winners of the Dataviz Competition 2023 and 2024 of the Data Connect Conference in Ohio (USA)
Finalists of the Wharton University Data Visualization Competition2020 (US)
Winners of two first prizes at Data Meets Art 2024 in Luxembourg
Top 10 Finalists in the Maven Analytics Data Visualization Challenge
Winners of the Zaragoza City Council’s Open Mobility Challenge 2021
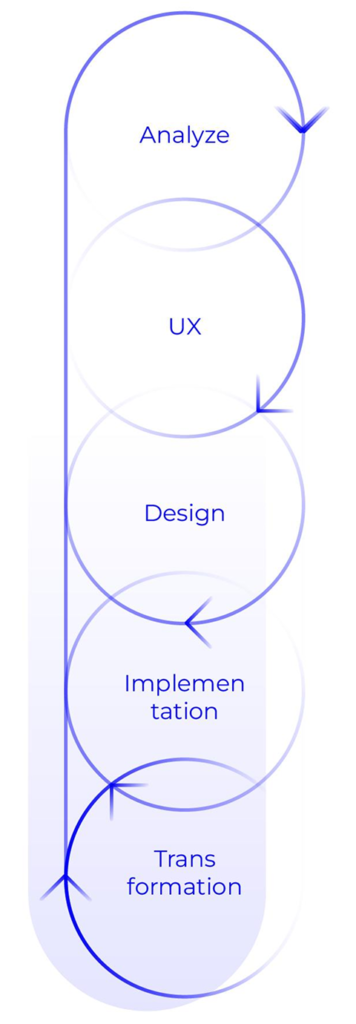
Our methodology for visualizing your data
At hiberus, our Data Insights team has developed the AUDIT methodology, designed to create effective dashboards by evaluating needs, designing optimized user experiences, implementing technical solutions, and transforming data into visually comprehensible information.
1. Analyse
Requirement definition
Data evaluation
2. UX
Needs assessment
Information architecture
Prototyping
Design and interaction patterns
3. Design
Initial data model architecture and design
Storytelling
Look & Feel
Visual elements
Graphics, layouts, and style guides
4. Implementation
Continuous improvement
User testing
Deployment in production
5. Transformation
Visual transformation and adaptation
Final product
Make Your Data Speak
Thanks to our expertise in data insights and design tools, we are able to create reports that not only communicate data, but also tell stories, convey clear ideas, and aid in decision-making.
We combine aesthetics with functionality, creating a visually striking and easy-to-understand experience.
We are your AI specialized partner
Our areas of specialization are designed to solve critical problems and meet the most urgent needs of our clients.
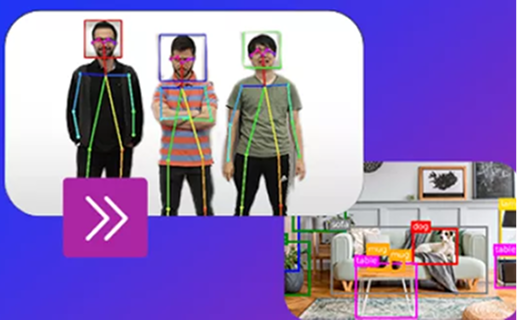
Computer Vision
We use advanced image processing and deep learning techniques to perform tasks such as object recognition, face detection, image generation, marketing campaigns, operations optimization, and new product creation.
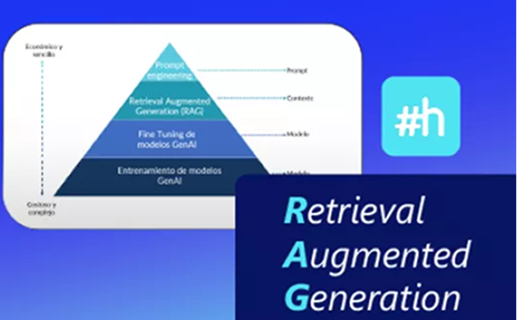
Retrieval Augmented Generation (RAG)
We implement cutting-edge technology to enhance the effectiveness and responses of Large Language Models (LLMs) by incorporating proprietary and reliable databases. This enables the generation of content and coherent, fact-based question-answering.
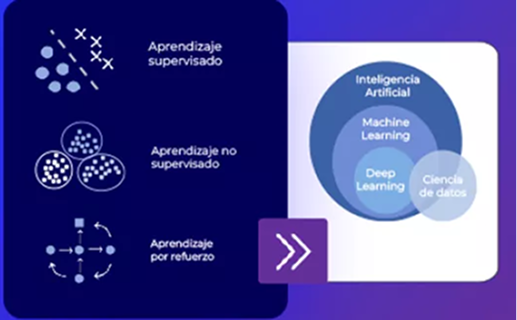
Machine Learning
We have an experienced team in data analytics projects that identify patterns and make automatic predictions. We are specialized and certified in Machine Learning by MIT and in Azure Data Scientist Fundamentals.
GenIA Ecosystem
Our team of Data and Artificial Intelligence specialists has developed GenIA Ecosystem, a set of proprietary solutions for conversational AI, content generation, and data analysis, tailored to meet the specific needs of each market and client. With these tools, we help you harness the potential of generative AI to take your business to the next level.
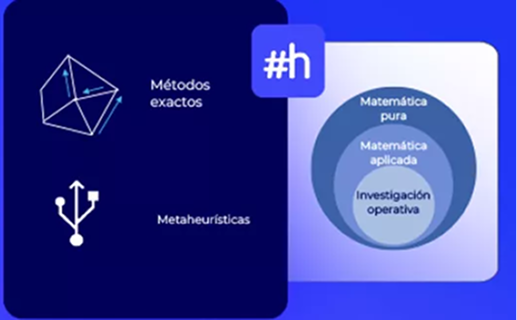
Mathematical Optimization
This branch of applied mathematics focuses on finding the optimal solution while respecting a set of constraints. We improve resource utilization with optimization models and solve problems using analytical methods and advanced computational algorithms.